A guide to profiling with XHPROF
If there's something we developers are really bad at, it's guessing. We think we know which parts of our application are slow, and spend a lot of time optimising those, but in reality the bottlenecks are often somewhere else. The only sane thing to do is measuring, with the help of some profiling tools.
There are a few profilers available for PHP, the most commonly used being Xdebug, which combined with KCacheGrind/WinCacheGrind/MacCallGrind can show the function call graph and the time spent in each function.
In this article, we're going to try another profiler, XHProf, developed at Facebook and open sourced in March 2009 (under the Apache 2.0 license). XHProf is a function-level hierarchical profiler, with a PHP extension (written in C) to collect the raw data, and a few PHP scripts for the reporting/UI layer.
According to Wikipedia:
Profiling, a form of dynamic program analysis (as opposed to static code analysis), is the investigation of a program's behaviour using information gathered as the program executes. The usual purpose of this analysis is to determine which sections of a program to optimise – to increase its overall speed, decrease its memory requirement, or sometimes both.
So a profiler is a tool that records the program events as they happen, and their effect on the system, collecting data with many different techniques. Some profilers only measure memory and CPU utilisation, others gather a lot more information, like full function call traces, times, and aggregate data. They can be flat or hierarchical, i.e. they can analyse each function by itself or in its context, with the full tree of its descendents.
Installation
At the moment, XHProf is only available for Linux and FreeBSD (and is expected to work with Mac OS).
The easiest way to get it is via the PEAR installer (package home):
apt-get install php5-common

pecl config-set preferred_state beta
pecl install xhprof
If it complains because it can't find config.m4, you can still build the extension manually, using the following steps:
wget http://pecl.php.net/get/xhprof-0.9.2.tgz
tar xvf xhprof-0.9.2.tgz
cd ./xhprof-0.9.2/extension/
phpize
./configure --with-php-config=/usr/local/bin/php-config
make
make install
make test
Once you have XHProf installed, you should enable it. Open your php.ini and add
[xhprof] extension=xhprof.so xhprof.output_dir="/var/tmp/xhprof"
Where /var/tmp/xhprof is the directory that will collect the profile data for each run.
Restart apache, and the XHProf extension should be enabled (check with "php -m" that this is the case).
Profile a block of code
To profile a block of code, wrap it around these two calls:
// your code

// start profiling
xhprof_enable(XHPROF_FLAGS_CPU + XHPROF_FLAGS_MEMORY);

// the code you want to profile

// stop profiler
$xhprof_data = xhprof_disable();
It is possible to dump the $xhprof_data array to view the raw profiler data for each function call (number of calls, wall time, CPU time, memory usage, peak memory usage) if you want to inspect these at any point.
xhprof_enable() accepts some flags to control what to profile: by default only call counts and elapsed time are profiled, you can add memory and CPU utilisation; make sure they're enabled in your dev environment (but disable the CPU timer if you use it in production, as it adds a high overhead). If you find the output too noisy, you can disable the reporting of builtin PHP functions with the XHPROF_FLAGS_NO_BUILTINS flag, or even exclude specific functions, by passing a second parameter like this:
// ignore builtin functions and call_user_func* during profiling
$ignore = array('call_user_func', 'call_user_func_array');
xhprof_enable(0, array('ignored_functions' =>  $ignore));
Profile an entire page
It's usually more useful to have a complete overview of the page, rather than a small block of code, and it's probably better to have such an overview formatted as a table or a graph, as opposed to an array dump. For this purpose, XHProf provides a convenient UI that must be enabled in order to be used.
The code for the XHProf UI can be found in the xhprof_html/ and xhprof_lib/ directories. Assuming they are created in /usr/local/lib/php/ , we can symlink that directory to /var/www/xhprof/ so it's available from our DocumentRoot.
We also need to create two PHP files:
/usr/share/php5/utilities/xhprof/header.php
<!--?php
if (extension_loaded('xhprof')) {
    include_once '/usr/local/lib/php/xhprof_lib/utils/xhprof_lib.php';
    include_once '/usr/local/lib/php/xhprof_lib/utils/xhprof_runs.php';
    xhprof_enable(XHPROF_FLAGS_CPU + XHPROF_FLAGS_MEMORY);
}
</pre-->
/usr/share/php5/utilities/xhprof/footer.php
if (extension_loaded('xhprof')) {
    $profiler_namespace = 'myapp';  // namespace for your application
    $xhprof_data = xhprof_disable();
    $xhprof_runs = new XHProfRuns_Default();
    $run_id = $xhprof_runs->save_run($xhprof_data, $profiler_namespace);

    // url to the XHProf UI libraries (change the host name and path)
    $profiler_url = sprintf('http://myhost.com/xhprof/xhprof_html/index.php?run=%s&source=%s', $run_id, $profiler_namespace);
    echo '<a href="'. $profiler_url .'" target="_blank">Profiler output</a>';
}
Finally, we add them to an .htaccess file so they're automatically prepended/appended to our pages:
php_value auto_prepend_file /var/www/xhprof/header.php
php_value auto_append_file /var/www/xhprof/footer.php
At the bottom of your pages, you should now have a link to the profiler output. This is a huge time saver, because every time you load the page, you have fresh profiler data, only one click away, and it doesn't require having external tools to parse and analyse it.
How to use XHPROF UI
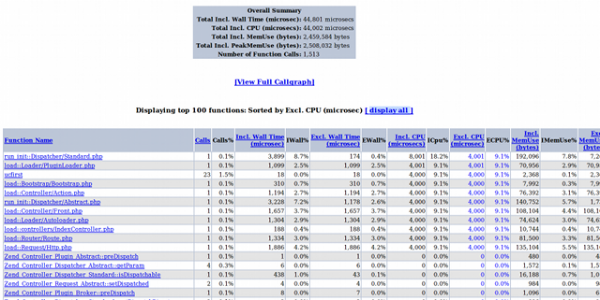
If you click on the link at the bottom of the page, a new page opens with the profiler data:

The page has a nice summary with overall statistics, and a table with all the function calls, that can be sorted by many parameters:
- Number of calls
- Memory usage
- Peak memory usage
- CPU time (i.e. CPU time in both kernel and user space)
- Wall time (i.e. elapsed time: if you perform a network call, that's the CPU time to call the service and parse the response, plus the time spent waiting for the response itself and other resources)
Memory usage and CPU time are further differentiated into 'Inclusive' and 'Exclusive'. Inclusive Time includes the time spent in the function itself and in all the descendant functions. Exclusive Time only measures time spent in the function itself, without including the descendant calls.
Finally, in the report page there's also an input box to filter by function name, and a link to the full call graph, similar to the one you would get with *CacheGrind. Make sure you have GraphViz installed (apt-get install graphviz).
As stated in the documentation, XHProf keeps track of only one level of calling context and is therefore only able to answer questions about a function looking either one level up or down. This is rarely a problem, since you can drill down or up at any level. Clicking on a function name in fact will show details about the current function, the parent (caller) and the children (called).

As a rule of thumb, when we're ready to optimise our application, we should start sorting the data by CPU (exclusive), and look at the top of the list. The functions at the top are the most expensive ones, so that's where we should focus our efforts and start optimising/refactoring. If there's nothing obviously wrong, we drill-down and see if there's something more evident at an inner level. After every change, we run the profiler again, to see the progress (or lack thereof). Once we are happy, we sort by Memory Usage or Wall time, and start again. Here's a quick summary if you want to print a step-by-step worksheet as a reference:
- Profile
- Sort by CPU/Memory usage, time (exclusive) and function calls
- Start from the top of the list
- Analyse, refactor and/or optimise
- Measure improvement
- Start over. Again, and again, and again
Profiling can be an extremely tedious process, because it requires a lot of patience, and a lot of time staring at numbers in a table (how exciting, eh?). Hopefully, the results of this process are exciting: improvements are often dramatic, since rewriting the slowest parts of the code (and not those we think are slow) has a considerable effect on the overall page load and ultimately on the user's experience. The advantage of using good tools is that they help maintaining discipline and focus, and thus in building experience.
Diffs and aggregate reports
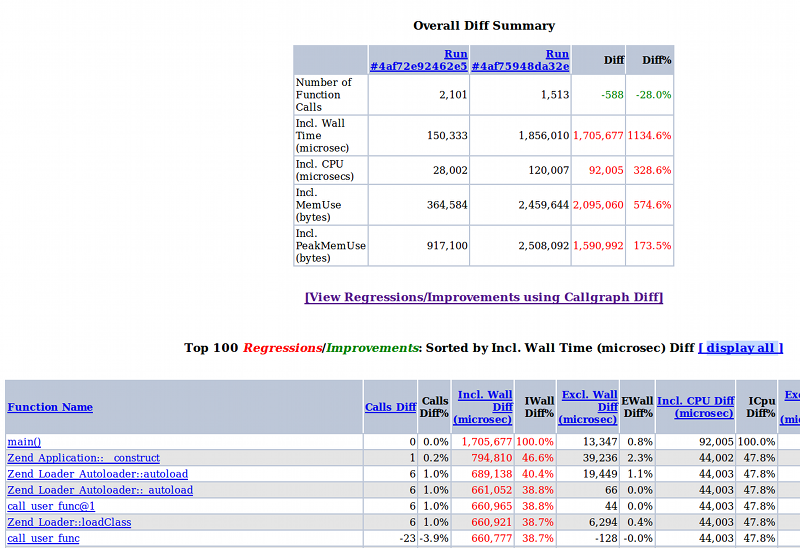
XHProf has a nice feature to get the differences between two different runs, clearly marked in red and green colours. This way it is easy to instantly see the improvements after every change. To view the report use a URL of the form:
http://%xhprof-ui-address%/index.php?run1=XXX&run2=YYY&source=myapp
Where XXX and YYY are run ids, and the namespace is 'myapp'.

Also, it's possible to aggregate the results of different runs, to 'normalise' the reports. To do so, separate the run IDs with a comma in the URL:
http://%xhprof-ui-address%/index.php?run=XXX,YYY,ZZZ&source=myapp
The path of scalability
Measure the baseline
As in every journey, you must know where you are and where you want to go. If you need your application to scale, you must know what your targets are (users/sec, memory usage, page generation time), as well as your constraints (of your application, framework, server resources).
Before even starting coding your application, it's a good idea to measure the baseline of your framework, if you use one. For instance, here's a summary of an empty Zend Framework project (NB: the same considerations apply to any framework; I do NOT intend to single out ZF as a bad framework):

Needless to say, this is a clear indicator that you must refactor that component.
Do less. Do nothing. Reuse.
When you identify a slow piece of code, before optimising it, rethink why you are doing something, if it's the right place to do it, and if possible reduce the amount of data you need to process. Only after these steps you can start worrying about the best way to do it.
I'm sure we all agree on the above statement, but sometimes it's not that obvious what to look for. Or we think we already optimised everything, the reports don't show any single resource hog, and we reached a dead end. This is when I find it useful to sort the XHProf reports by number of function calls.
Usually, it is not a good indicator of the performance of a piece of code, because a single function responsible to retrieve data from an external source is a few orders of magnitude slower than many calls to an internal PHP function, for instance.
On the other hand, even if PHP is fast, do we really need to call strtolower() 15000 times? Looking for odd things like this might give some hints on how we process data, and maybe come up with a better way. Too often we tend to bash a language for its slowness, and we tend to forget that usually performance issues have more to do with the implemented algorithms than with the operations used.
Here are some other code smells that might suggest we are doing something in a sub-optimal way:
- Immutable functions called within loops
- Same content being generated twice
- Content that don't change being generated every time
- Content being generated even if not used
All these cases are perfect candidates for caching. Of course I'm not suggesting caching everything. Remember that memory is another limited resource, so don't abuse it if you need to scale; the key is to spread the load uniformly across all the available resources. You have to think about the cache-hit ratio, and start caching things you hit all the times. Also, it makes little sense to cache if it takes more effort writing to the cache than you save. But more often than not, you can cache a LOT of content.
In order of effectiveness, you can use static variables, APC, memcached. But do not forget about other kind of caches that are even more effective: proxy cache (or reverse-proxy), and of course the user's browser. If you send the correct headers, many requests will be resolved before even reaching the server!
Some of the above mentioned code smells, even if apparently obvious, are in practice not very simple to spot. For loops and content being generated more than once, it should be quite easy, just look at the number of times a certain function is called and draw your conclusions.
Identifying data being processed but not used might be harder: you see the traces, and ideally you should think why you are seeing those calls at all, or why you see them in that particular place. That's why a lot of discipline is required: you keep looking at those reports for so long that you wish you could eliminate (violently) as many calls as possible so you don't have to look at them anymore.
Decouple services
Do not rely on having all the resources available on the same machine. The more you decouple the various services, the easier it is to scale horizontally. Problem is, how to identify the parts to decouple?
Well, first of all think about all the services that can be logically separate from the application itself, like all the data sources, content providers, data stores, but also the data-processing routines that are effectively black boxes.
Then you might look at the profiler, and see if there's a resource-intensive routine: can you move it to another machine? Can you maybe add -say- a thin RESTful interface around it?
If so, then that service can be moved out of your app, and taken care of separately (e.g. with horizontal replication, if it's a data store, or put on a cluster behind a load balancer if it's a data processor).
Profile under load
As a last suggestion, it's a good idea to collect profiler data under load, which is probably more representative of the real usage. To collect a random sample of profiler data, you can run a load testing tool (e.g. apache ab, siege, avalanche) and save a XHProf run every 10000 runs, by modifying the included scripts like this: /usr/share/php5/utilities/xhprof/header.php
$xhprof_on = false;
if (mt_rand(1, 10000) === 1) {
    $xhprof_on = true;
    if (extension_loaded('xhprof')) {
        include_once '/usr/local/lib/php/xhprof_lib/utils/xhprof_lib.php';
        include_once '/usr/local/lib/php/xhprof_lib/utils/xhprof_runs.php';
        xhprof_enable(XHPROF_FLAGS_CPU + XHPROF_FLAGS_MEMORY);
    }
}
/usr/share/php5/utilities/xhprof/footer.php
if ($xhprof_on && extension_loaded('xhprof')) {
    $profiler_namespace = 'myapp';  // namespace for your application
    $xhprof_data = xhprof_disable();
    $xhprof_runs = new XHProfRuns_Default();
    $run_id = $xhprof_runs->save_run($xhprof_data, $profiler_namespace);

    // url to the XHProf UI libraries (change the host name and path)
    $profiler_url = sprintf('http://myhost.com/xhprof/xhprof_html/index.php?run=%s&source=%s', $run_id, $profiler_namespace);
    echo '<a href="'.$profiler_url.'" target="_blank">Profiler output</a>';
}
If your load testing tool can generate reports on CPU and memory usage over time, and collect statistics on what external services are accessed and with what frequency, then by all means observe those graphs, they give a lot of information on the real behaviour of your application and its critical areas. This is a goldmine when it comes to understanding what remains to be optimised.
Also make sure the response time remains as flat as possible, without too many spikes or an exponential growth as the load increases. This is a good indicator of stable code and a stable architecture.
Some parting thoughts
If you really want to achieve considerable speed gains and scalability improvements, you often have to be ruthless, question everything, ask all the stupid questions, follow the 5 Whys principle and yes, be prepared to annoy everyone else in the team. I think I did that more than once, and I apologise sincerely, but it was in a good cause!
Resources
Some links with more detail about some of the topics mentioned, and some further reading:


